Trying to choose between the Mesa, Downtown, or the Riviera — and feeling stuck? You are not alone. Most Santa Barbara buyers juggle commute, beach access, daily conveniences, style, and budget. This guide gives you a simple way to compare neighborhoods with current market snapshots and the right local tools. Let’s dive in.
A simple way to compare neighborhoods
Commute and connectivity
Santa Barbara County’s mean travel time to work is about 20.8 minutes, which sets a helpful baseline for what a normal commute feels like here. See the county overview on the U.S. Census for context on typical travel times and how yours might compare. If you rely on transit, note that MTD runs city routes, waterfront shuttles in peak seasons, and express lines to Goleta and Carpinteria. If you split time between LA or SLO, the Amtrak Pacific Surfliner at the downtown station adds flexibility.
- Use your exact work hours to test drive times during peak periods.
- If bus access matters, verify the route and frequency near your target block.
- Consider biking and walking for Downtown, Waterfront, and the Mesa. Hillside areas are more car dependent.
According to the county profile, mean commute time is 20.8 minutes. Use that as a gut check when you weigh 10 to 30 minute cross‑town drives versus longer 101 corridor commutes.
Coastal access and tradeoffs
Living close to the water is a Santa Barbara essential for many buyers. Beach adjacency ranges from bluff‑top parks like Shoreline Park to walkable sand access near West Beach and the Harbor. Proximity brings wind, salt air, visitor activity, and parking constraints. If you are targeting bluff or low beach parcels, use the NOAA Sea Level Rise Viewer as a screening tool and follow up with site‑specific due diligence.
Amenities and daily life
Map the basics you will use weekly. Downtown and the Waterfront cluster restaurants and services, while La Cumbre Plaza and upper State Street offer shopping corridors. Santa Barbara Cottage Hospital anchors local health care. To confirm exact distances and park access for any address, use the City’s MAPS and GIS viewer.
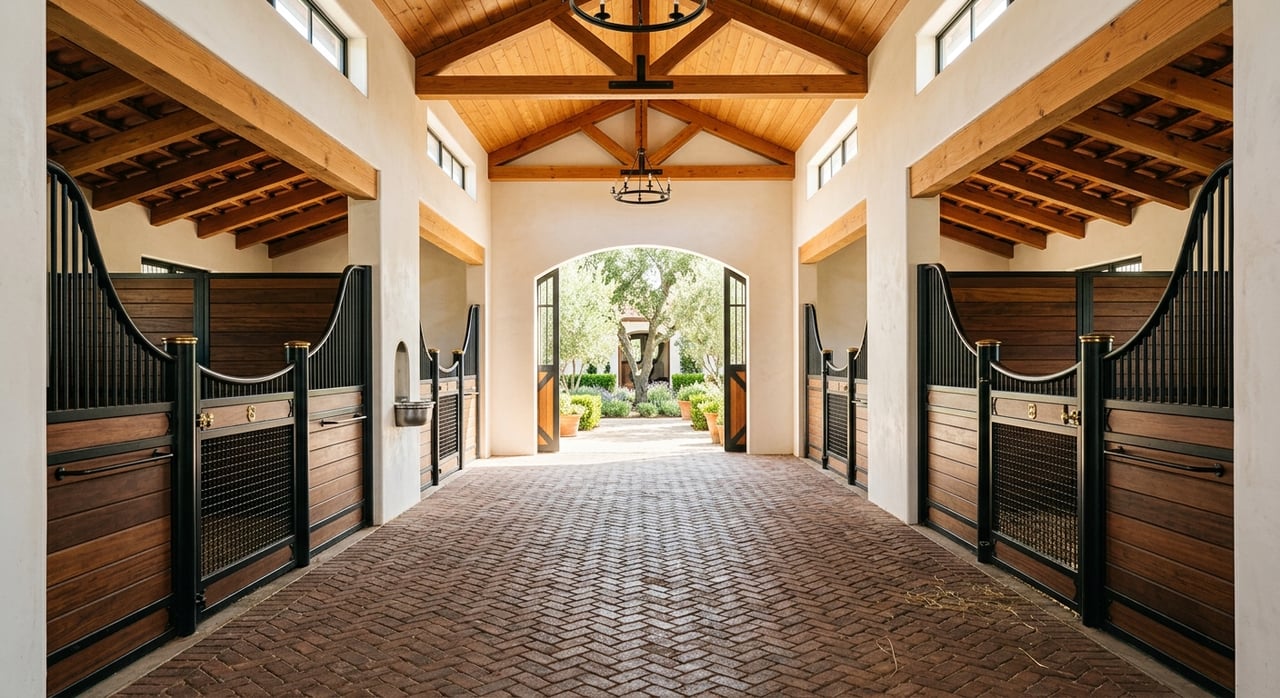
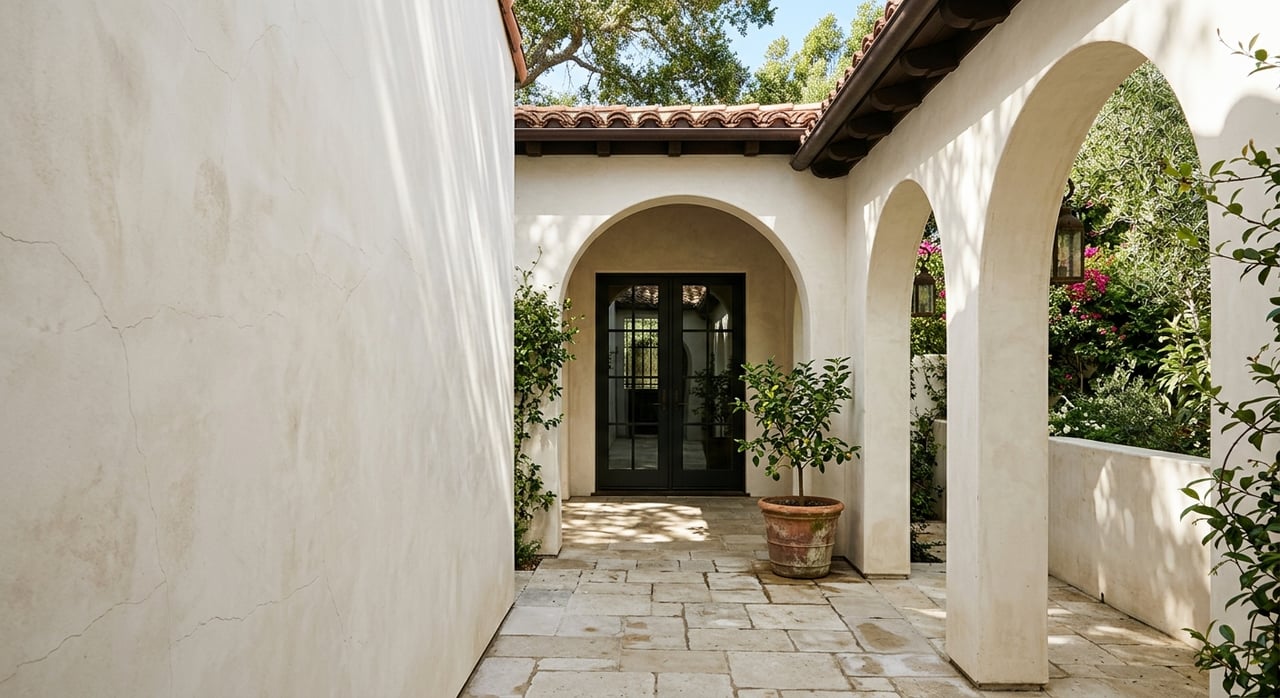
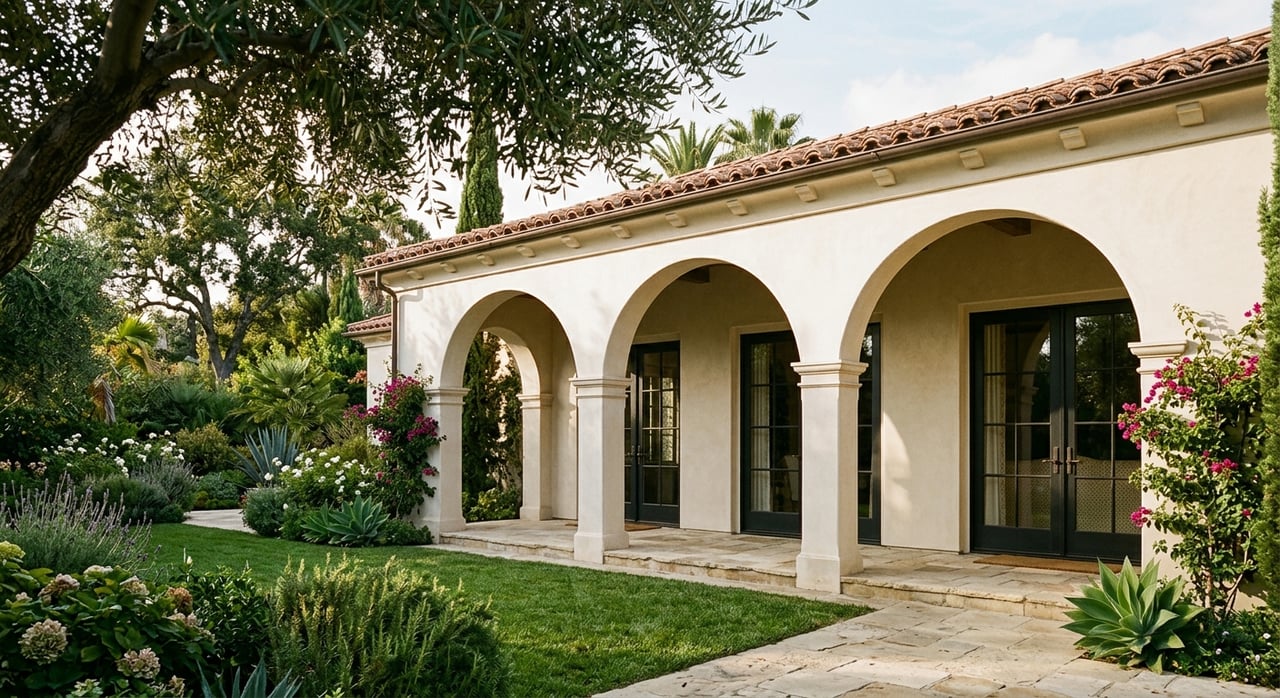
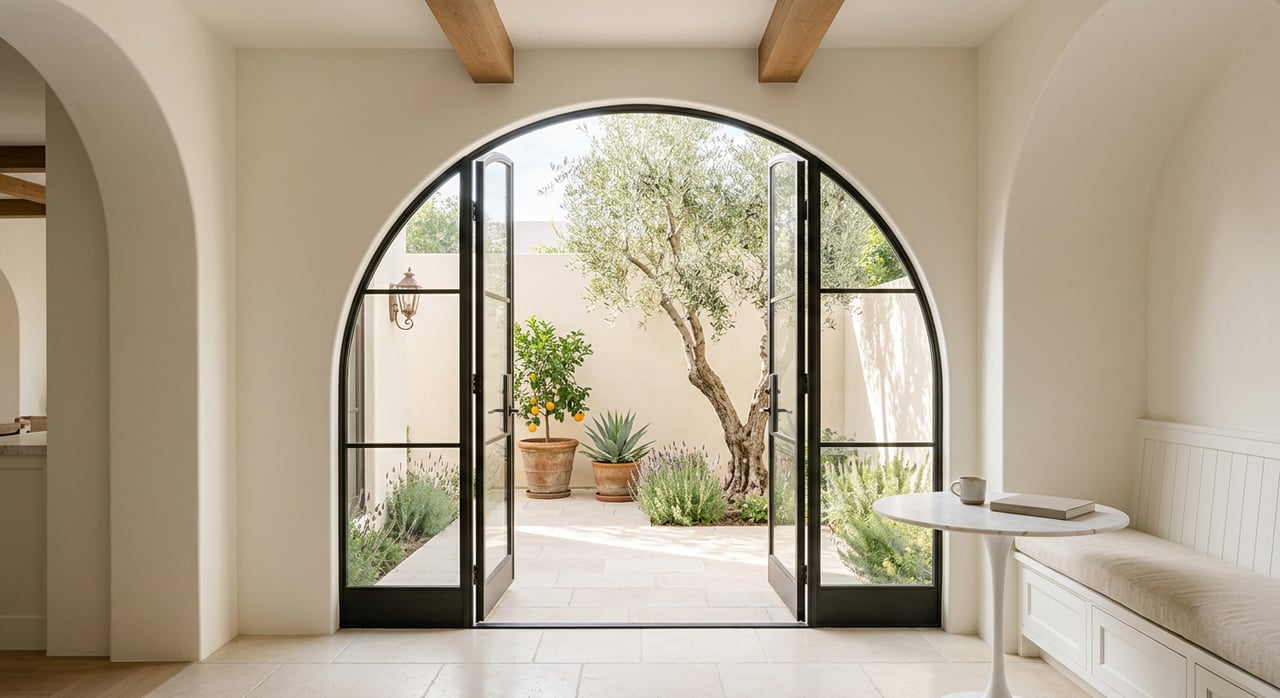
Housing style and local rules
Santa Barbara’s look blends Spanish and Mediterranean influences with Craftsman bungalows and thoughtful infill. If design character or future remodeling flexibility matters to you, review the City’s updated Objective Design and Development Standards, adopted in 2025. These standards guide multi‑unit design citywide and help you anticipate how nearby parcels could evolve. Single‑family projects also go through established design review, which protects neighborhood character and views in many areas.
Budget bands and market dynamics
City medians sit in the high single‑ to low double‑million range, and neighborhood medians shift month to month. Always verify current data at offer time. As January 2026 snapshots:
- Downtown core median about $1.8M, with condos, townhomes, and historic homes near State Street. See the latest on Downtown market data.
- The Mesa median about $2.45M, trading larger lots for close beach access and Shoreline Park. Check the Mesa snapshot.
- Waterfront and West Beach medians around $1.7M in recent snapshots, reflecting a mix of condos and smaller single‑family pockets near the Harbor.
- Montecito median about $5.3M, a separate unincorporated luxury market. View the Montecito page.
Inventory is tight and days on market can change quickly. Align your search with current, block‑level comps before touring.
Hazards and insurability
Wildfire and coastal‑flood exposure vary across micro‑areas. Updated Local Responsibility Area Fire Hazard Severity Zone maps were released in 2025. Check the county fire page to see how a parcel is designated and what that may mean for insurance and home hardening. Start insurance quotes early if a home sits in a higher‑hazard zone. Review the LRA updates here: Santa Barbara County fire hazard severity maps. For shoreline properties, recheck NOAA SLR and ask for recent disclosures about bluff stability or tide effects.
Regulatory and supply signals
City policy affects where new multi‑unit housing and conversions are most likely. Santa Barbara adopted its 2023–2031 Housing Element, which state agencies certified in 2024. If you want to understand where change could occur, consult the City’s Housing Element and its suitable‑sites resources. This can clarify which corridors and parcels are most likely to see redevelopment during this cycle.
Neighborhood snapshots at a glance
Downtown / State Street / Presidio: Highly walkable, close to dining, culture, and the Amtrak station. Mix of condos, townhomes, and historic homes. Visitor activity is a tradeoff. Typical January 2026 median about $1.8M, per Downtown Redfin data.
The Mesa: Everyday beach access and bluffs, from Leadbetter to Mesa Lane. Classic beach cottages and remodeled homes on smaller lots. Tradeoffs include salt air and seasonal parking pressure. January 2026 median about $2.45M, per the Mesa snapshot.
Waterfront / Harbor / West Beach: Steps to the sand, Harbor, and Cabrillo recreation paths. Very walkable, with seasonal visitor activity and tighter parking. Recent medians around $1.7M.
Riviera and Westside: The Riviera offers hillside views, larger lots, and winding streets. Medians there typically sit above the city median. The Westside provides relatively quick access to neighborhood shops and downtown.
Mission Canyon / San Roque / Upper East: Quieter residential streets with older bungalows and hillside properties. More lot size variation and proximity to the Mission and downtown.
Montecito: Unincorporated luxury market with estates and boutique amenities near Butterfly Beach and Coast Village Road. January 2026 median about $5.3M, per Montecito Redfin.
Hope Ranch: Gated, unincorporated coastal community with privacy, acreage, and private beach access. Medians are consistently in multi‑million tiers.
Goleta & Isla Vista: More suburban inventory near UCSB, the airport, and tech employers. Often broader price points with convenience to Goleta job centers.
Carpinteria: Small‑town beach feel south of Santa Barbara. Many buyers trade a slightly longer commute for a more relaxed coastal setting and broader mid‑market options.
Build your short list in five steps
- Define your commute limit. Test it at your actual peak hour and note any 101 bottlenecks. Compare that to the 20.8 minute county baseline for context.
- Choose your coastal comfort zone. Decide if you want walkable sand, a bluff‑top park, or simply quick access by bike or car. Note wind, salt air, and visitor patterns.
- Map daily essentials. Use the City’s GIS viewer to check groceries, parks, and health care within a 5 to 10 minute radius.
- Align budget with real medians. Use current neighborhood comps, not just citywide numbers, and confirm snapshots right before you offer.
- Screen risk and insurability early. Check wildfire and coastal exposure, then get preliminary insurance quotes if you are near higher‑hazard zones.
Touring tips that save time
- Start with two contrasting areas, like Downtown and the Mesa, to sharpen your priorities fast.
- Visit at two times of day to see traffic, light, and neighborhood activity.
- Park and walk a half mile in each direction to feel slope, wind, and noise.
- If you plan a remodel, review ODDS and design review basics before you fall in love.
- Keep a simple scorecard: commute, coastal access, services, style, risk, and price.
When you are ready for tailored guidance, off‑market leads, and a focused touring plan, connect with Rachel E Brown for local, data‑driven representation.
FAQs
How should I estimate my Santa Barbara commute?
- Test your route at your exact start time, compare it to the 20.8 minute county baseline, and check bus frequency if you plan to use MTD during peak hours.
What should I weigh if I want to live near the beach?
- Balance walkability with wind, salt air, seasonal parking, and long‑term coastal considerations by screening with NOAA’s Sea Level Rise Viewer, then confirm site specifics.
How do neighborhood prices compare right now?
- January 2026 snapshots show Downtown around $1.8M, the Mesa about $2.45M, Waterfront near $1.7M, and Montecito about $5.3M; verify current numbers before offering.
How do I check fire or flood risk on a property?
- Look up the address on the county’s 2025 Fire Hazard Severity Zone updates and screen coastal exposure with the NOAA SLR Viewer, then obtain early insurance quotes if needed.
What local rules could affect neighborhood character?
- Review the City’s Housing Element for likely sites of future multi‑unit housing and the updated Objective Design and Development Standards for how new projects are shaped.
Where can I see maps for parks and services near a home?
- Use the City’s MAPS and GIS viewer to check parks, trails, and key services around any address before you tour.